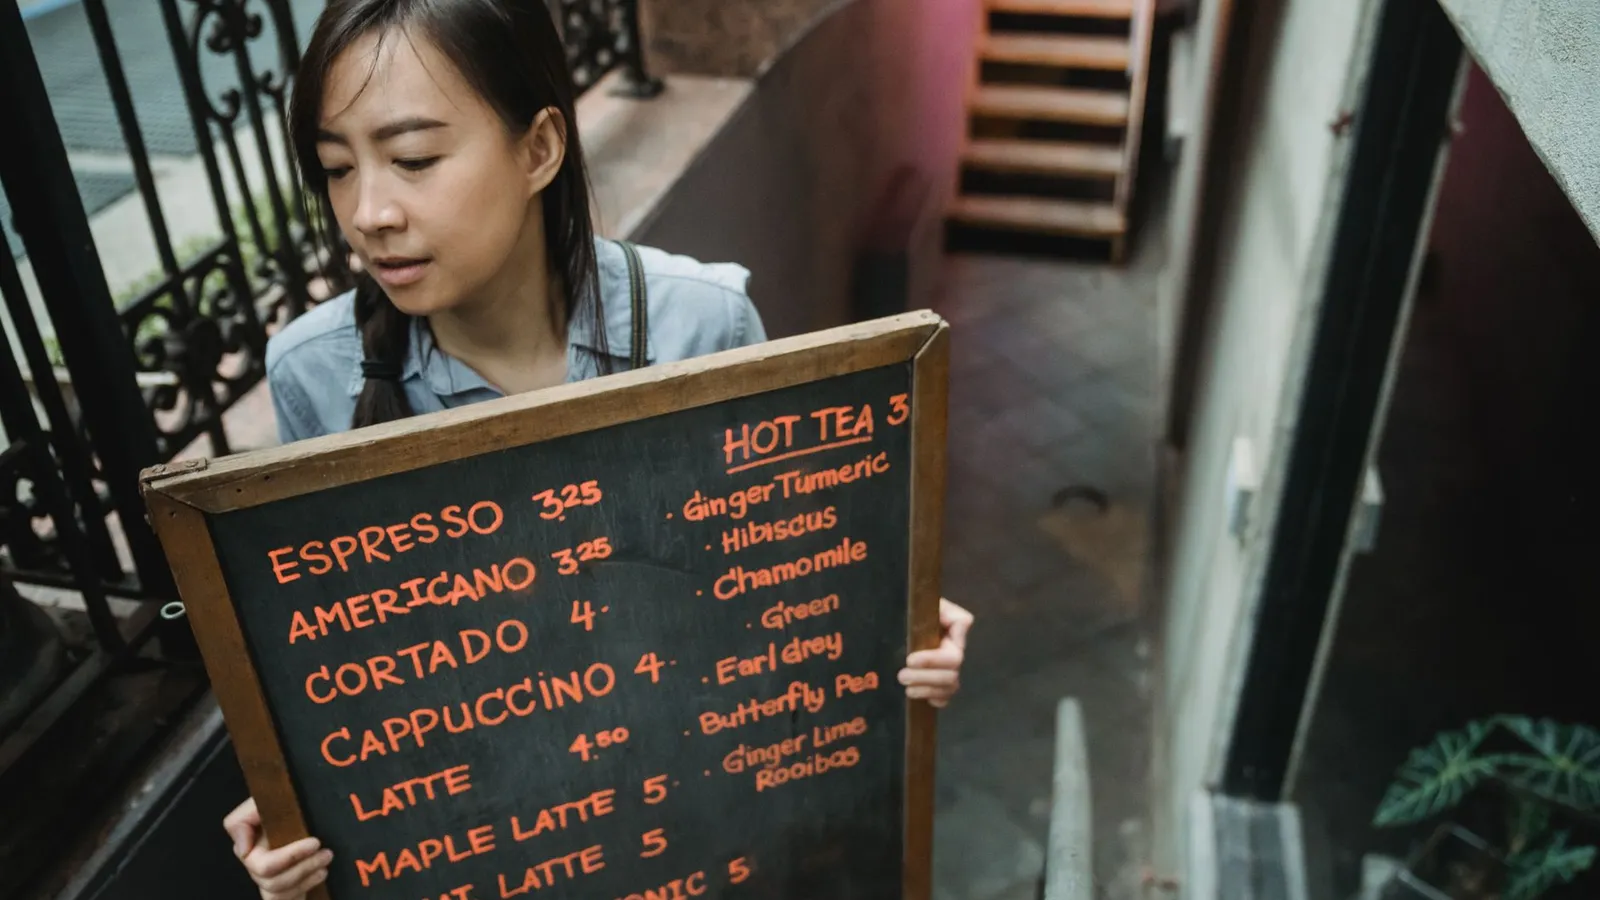
Restaurant menu prices 2026: reprice dish by dish
What the new numbers say
The Bureau of Labor Statistics published its Consumer Price Index for September 2026 on October 14. The food away from home index, the government's closest measure of restaurant prices, rose 0.2% in September and 3.5% over the past year. Within that index, full service meals rose 3.8% over 12 months and limited service meals rose 3.2%.
Grocery prices moved more slowly. The food at home index rose 1.8% over the same 12 months. So eating out has become more expensive faster than cooking at home. Diners who compare a takeout order with a grocery run are likely to notice that gap.
On October 23 the USDA Economic Research Service updated its Food Price Outlook using the September data. It forecasts that food-away-from-home prices will rise 3.5% in 2026, which matches their 2006–2025 average of 3.5% a year. For 2027 it forecasts 2.8%, with a wide range of 0.7% to 5.0%.
The headline numbers matter less to a local restaurant than the category detail underneath them. The ingredients behind your dishes are moving in very different directions.
Ingredient costs are splitting apart
These are the ERS 2026 retail price forecasts for the categories most menus depend on, with the September year-over-year change where ERS reports it:
| Category | 2026 forecast | Sept 2026 vs Sept 2025 |
|---|---|---|
| Beef and veal | +8.7% | +3.5% |
| Sugar and sweets | +6.5% | +5.5% |
| Fresh vegetables | +5.8% | +2.8% |
| Nonalcoholic beverages | +4.4% | +3.8% (coffee alone +7.1%) |
| Fresh fruits | +2.9% | +4.9% |
| Poultry | +1.2% | +1.1% |
| Pork | +1.0% | -0.7% |
| Dairy products | -0.4% | -0.7% |
| Eggs | -29.3% | -20.6% |
ERS also reports pressure further up the supply chain. It forecasts farm-level wheat prices up 22.6% in 2026 and farm-level vegetable prices up 21.2%. It expects beef production to stay below year-ago levels through the end of 2026, and it forecasts wholesale beef up 8.8%.
Two cautions before you use these numbers. First, they are mostly retail (grocery shelf) forecasts and annual averages. They are not your distributor's invoice prices. Second, they swing from month to month: wholesale beef rose 2.6% from August to September yet was 3.6% lower than a year earlier. Treat the forecasts as a way to rank which dishes are exposed, then confirm with your own invoices.

The method: reprice each dish by what is in it
Many operators raise every price by the same percentage once a year. When beef is climbing and eggs are falling, that approach overprices some dishes and underprices others. Here is a five-step alternative you can run in a spreadsheet:
- List your top 15–20 sellers. They carry most of your revenue, so they are where pricing matters most.
- Break each dish into its main cost components using your current invoice prices: protein, produce, dairy, starch and bakery, and everything else.
- Tag each component with a category from the table above and apply the forecast change. Hold a component flat when ERS gives no number for it, or use your own invoice trend.
- Recalculate the plate cost and the food-cost percentage at today's menu price.
- Solve for the price that restores your target food-cost percentage: new plate cost ÷ target percentage = new price. Then round to a price that fits your menu.
Worked example 1: a cheeseburger plate
The figures below are illustrative. Use your own.
- Menu price: $14.00
- Beef: $2.00 · produce and potatoes: $0.90 · cheese: $0.30 · bun and everything else: $0.80
- Plate cost: $4.00, a food cost of 28.6%
Apply the 2026 forecasts:
- Beef: $2.00 × 1.087 = $2.174 (+$0.174)
- Produce: $0.90 × 1.058 = $0.952 (+$0.052)
- Cheese (dairy): $0.30 × 0.996 = $0.299 (-$0.001)
- Bun and other: held flat at $0.80
The new plate cost is about $4.225. At $14.00, food cost rises to 30.2%. To get back to the original food cost (about 28.6%, or $4.00 ÷ $14.00): $4.225 ÷ ($4.00 ÷ $14.00) ≈ $14.79. That is an increase of about 5.6%, well above the 3.5% headline. If you only raised the price by 3.5% (to $14.49), the burger would run at about 29.2% food cost and quietly lose margin.
Worked example 2: a two-egg breakfast
- Menu price: $11.00
- Eggs: $0.60 · bacon (pork): $0.70 · potatoes and vegetables: $0.40 · toast, butter and other: $0.50
- Plate cost: $2.20, a food cost of 20.0%
Apply the forecasts:
- Eggs: $0.60 × 0.707 = $0.424 (-$0.176)
- Bacon: $0.70 × 1.010 = $0.707 (+$0.007)
- Potatoes and vegetables: $0.40 × 1.058 = $0.423 (+$0.023)
- Toast and other: held flat at $0.50
The new plate cost is about $2.054, an 18.7% food cost at the same $11.00 price. This dish needs no increase. Holding its price, or featuring it, is a way to offer value while the burger absorbs its higher cost.
Decision table: what to do by category
| If a dish is driven by… | 2026 direction | Suggested menu action |
|---|---|---|
| Beef (burgers, steak, pho, bulgogi, brisket) | Up sharply | Reprice from your invoices; consider a smaller portion or a lower-cost protein option next to it |
| Fresh vegetables (salads, stir-fries, bowls) | Up | Check vegetable-heavy dishes; adjust garnishes and sides before raising the main price |
| Coffee and drinks | Up | Review beverage prices on their own; they are easy to overlook in a menu-wide increase |
| Sweets and desserts | Up | Check dessert and chocolate items separately |
| Poultry and pork (wings, fried chicken, carnitas) | Roughly flat | Small or no change; these can anchor value pricing |
| Eggs and dairy (breakfast, custards, cheese-heavy dishes) | Down or flat | Hold prices or promote; let these dishes carry your value message |
Why this matters more for small restaurants
The 3.5% versus 1.8% gap means diners see restaurant prices pulling away from grocery prices. Price-sensitive guests react to the numbers they notice most, such as a burger crossing $15 or a coffee price that jumped. Pricing dish by dish lets you put increases where your costs actually went up and keep prices steady where they did not. That gives you an honest answer when a regular asks why the menu changed.
It also helps to publish the updated menu everywhere at once: your own ordering page, printed menus and any directory listing. Different prices in different places confuse guests at the moment you want them to trust your pricing. Many restaurants listed on DarfarMenu take orders directly. For them, the direct-order menu is the one guests compare against everything else.
Dates to watch
- November 10, 2026: BLS is scheduled to publish the October CPI, according to the September release. That is a good moment to recheck your top dishes.
- After each new CPI: the October Food Price Outlook was built on September CPI data, so check the page for a newer version after the October CPI comes out. If the beef or vegetable forecast moves by a point or more, rerun your spreadsheet.
- Before holiday menus print: run the five-step check on any seasonal specials before you commit to printed prices for December.
Frequently asked questions
How much did restaurant prices go up in 2026?
According to the BLS Consumer Price Index, food away from home rose 3.5% in the 12 months ending September 2026. Full service meals rose 3.8% and limited service meals rose 3.2%. USDA forecasts a 3.5% increase for 2026 as a whole.
Why are restaurant prices rising faster than grocery prices?
The CPI shows grocery (food at home) prices up 1.8% over the same period, against 3.5% for restaurants. Restaurant prices include labor, rent and other operating costs as well as ingredients, so they can rise even when some grocery categories fall. The CPI release itself does not break down the reasons.
Should I raise every menu price by 3.5%?
Usually not. USDA forecasts beef up 8.7% and eggs down 29.3% in 2026, so dishes are exposed very differently. Recalculate the plate cost for your top sellers and price each dish to your target food-cost percentage.
Are the USDA forecasts the same as what I pay my distributor?
No. Most ERS forecasts are for retail grocery prices and are annual averages. Use them to rank which dishes are most exposed, then confirm with your own invoice prices before changing the menu.
When is the next inflation update?
The September CPI release says BLS will publish October 2026 data on Tuesday, November 10, 2026, at 8:30 a.m. ET. USDA's ERS October 2026 Food Price Outlook was built on the September CPI; check the ERS page for an updated version after the October CPI is released.
Sources
- Consumer Price Index - September 2026 (news release), U.S. Bureau of Labor Statistics, 2026-10-14
- Food Price Outlook - Summary Findings (October 2026 forecast), USDA Economic Research Service, 2026-10-23
Checked November 3, 2026. Photo: Mizuno K / Pexels.
More from this site
Independent guides, updated November 2026. See our full article library.